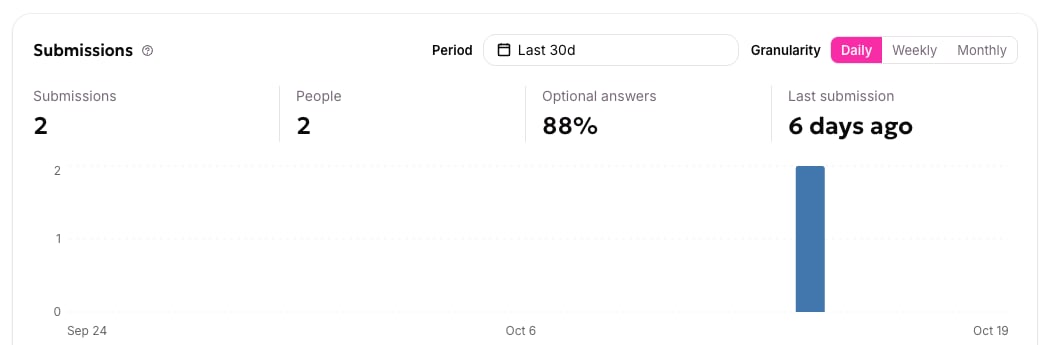
Open a form and select the Status tab to see how many people submit it over time, and how fully they answer it.
Submissions over time, alongside People, Optional answers, and Last submission

Submissions over time, alongside People, Optional answers, and Last submission.

You can switch the chart between daily, weekly, and monthly views. The stat tiles summarize the same period.

Optional fields answered

Once your form has real submissions, you see how often people fill in each optional field, not just the overall percentage in the stat tile.

Each optional field's own completion rate, once submissions exist

Each optional field's own completion rate, once submissions exist.

If one field is answered much less often than the others, take a second look. It may ask for something people don’t want to give, or sit where they are likely to miss it.
The Status tab also previews your form’s fields and its top placements. For the full list of every page and campaign using the form, see Find where a form is used.